Splunk Setup
Configuration for K8s POD (Docker) Logs Timestamps
If you have multiple timestamps like:
{"log":"1:C 15 Jul 10:45:11.952 # oO0OoO0OoO0Oo Redis is starting oO0OoO0OoO0Oo\n","stream":"stdout","time":"2019-07-15T10:45:11.9539845Z"}
{"log":"1:C 15 Jul 10:45:11.952 # Redis version=4.0.14, bits=64, commit=00000000, modified=0, pid=1, just started\n","stream":"stdout","time":"2019-07-15T10:45:11.954027528Z"}
{"log":"1:C 15 Jul 10:45:11.952 # Warning: no config file specified, using the default config. In order to specify a config file use redis-server /path/to/redis.conf\n","stream":"stdout","time":"2019-07-15T10:45:11.954032886Z"}
{"log":"1:M 15 Jul 10:45:11.955 * Running mode=standalone, port=6379.\n","stream":"stdout","time":"2019-07-15T10:45:11.955395061Z"}
{"log":"1:M 15 Jul 10:45:11.955 # WARNING: The TCP backlog setting of 511 cannot be enforced because /proc/sys/net/core/somaxconn is set to the lower value of 128.\n","stream":"stdout","time":"2019-07-15T10:45:11.955457142Z"}
{"log":"1:M 15 Jul 10:45:11.955 # Server initialized\n","stream":"stdout","time":"2019-07-15T10:45:11.955463896Z"}
{"log":"1:M 15 Jul 10:45:11.955 # WARNING you have Transparent Huge Pages (THP) support enabled in your kernel. This will create latency and memory usage issues with Redis. To fix this issue run the command 'echo never \u003e /sys/kernel/mm/transparent_hugepage/enabled' as root, and add it to your /etc/rc.local in order to retain the setting after a reboot. Redis must be restarted after THP is disabled.\n","stream":"stdout","time":"2019-07-15T10:45:11.955499192Z"}
{"log":"1:M 15 Jul 10:45:12.124 * DB loaded from disk: 0.169 seconds\n","stream":"stdout","time":"2019-07-15T10:45:12.129959744Z"}
{"log":"1:M 15 Jul 10:45:12.124 * Ready to accept connections\n","stream":"stdout","time":"2019-07-15T10:45:12.129988781Z"}
{"log":"1:M 15 Jul 10:50:12.017 * 100 changes in 300 seconds. Saving...\n","stream":"stdout","time":"2019-07-15T10:50:12.017567933Z"}
{"log":"1:M 15 Jul 10:50:12.017 * Background saving started by pid 12\n","stream":"stdout","time":"2019-07-15T10:50:12.017982346Z"}
{"log":"12:C 15 Jul 10:50:12.688 * DB saved on disk\n","stream":"stdout","time":"2019-07-15T10:50:12.688433246Z"}
{"log":"12:C 15 Jul 10:50:12.689 * RDB: 0 MB of memory used by copy-on-write\n","stream":"stdout","time":"2019-07-15T10:50:12.689237494Z"}
{"log":"1:M 15 Jul 10:50:12.728 * Background saving terminated with success\n","stream":"stdout","time":"2019-07-15T10:50:12.728976365Z"}
{"log":"1:M 15 Jul 10:55:16.875 * 100 changes in 300 seconds. Saving...\n","stream":"stdout","time":"2019-07-15T10:55:16.875731998Z"}
{"log":"1:M 15 Jul 10:55:16.876 * Background saving started by pid 13\n","stream":"stdout","time":"2019-07-15T10:55:16.877000117Z"}
{"log":"13:C 15 Jul 10:55:17.481 * DB saved on disk\n","stream":"stdout","time":"2019-07-15T10:55:17.482132948Z"}
{"log":"13:C 15 Jul 10:55:17.482 * RDB: 0 MB of memory used by copy-on-write\n","stream":"stdout","time":"2019-07-15T10:55:17.482905954Z"}
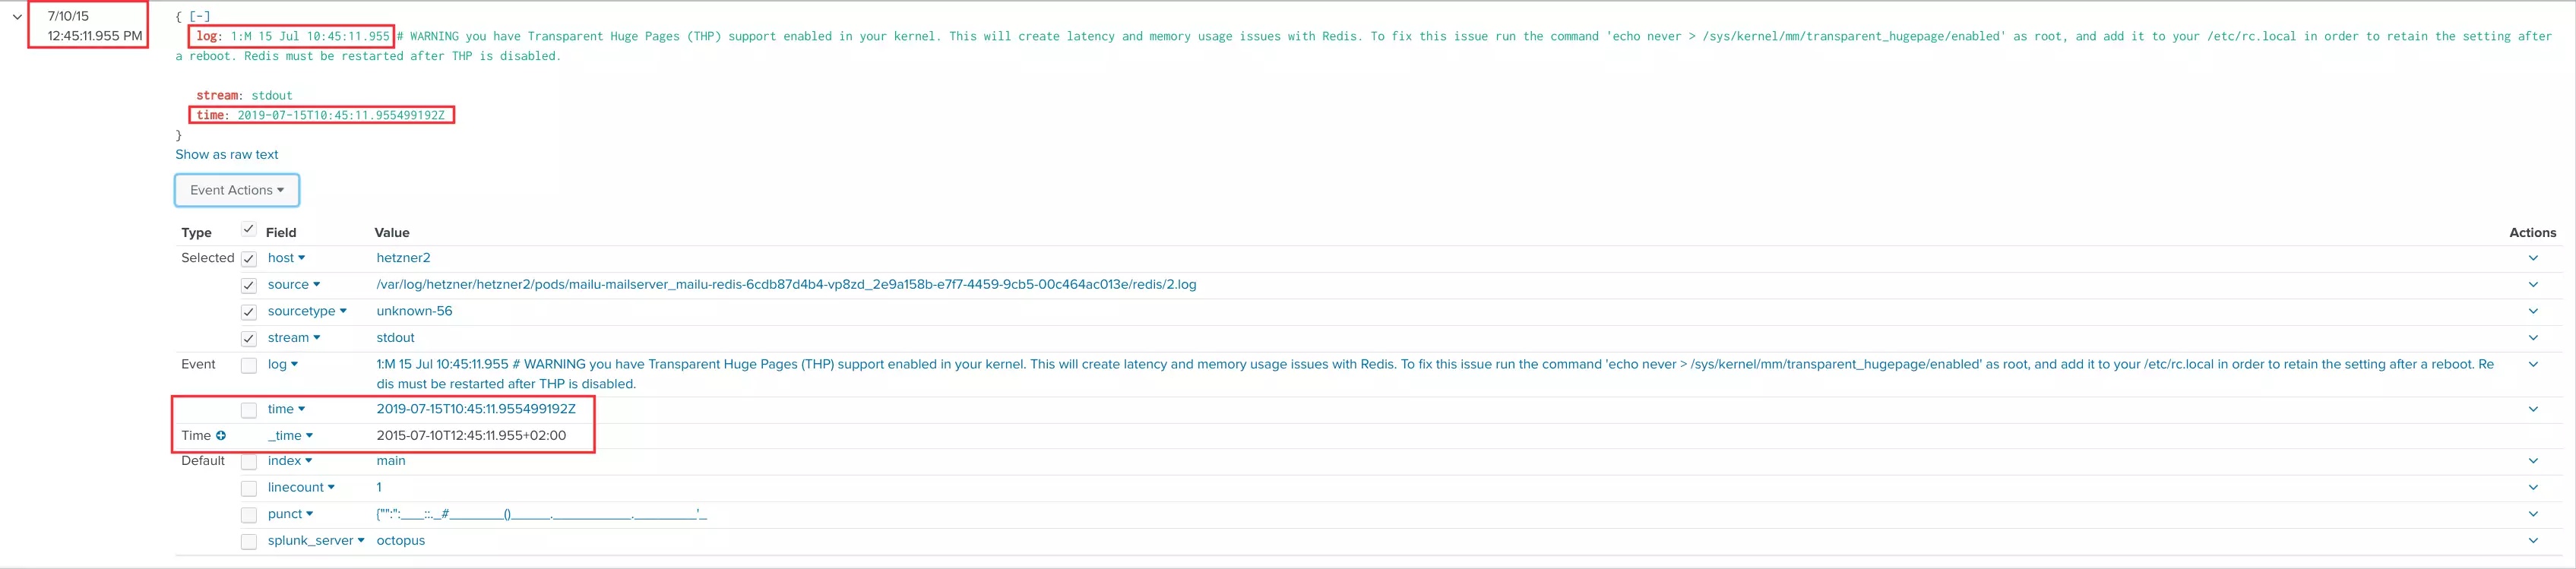
{"log":"1:M 15 Jul 10:55:17.578 * Background saving terminated with success\n","stream":"stdout","time":"2019-07-15T10:55:17.578733797Z"}you need to tell Splunk which fields to index. Otherwise you get a mismatch between event_time and index_time:
Use the following specification to force Splunk to use the timestamp with the "time":" prefix in the end of a log line:
cat <<EOF >/opt/splunk/etc/system/local/props.conf
[source::/var/log/hetzner/*]
TZ = GMT
TIME_FORMAT = %Y-%m-%dT%H:%M:%S.%9QZ
TIME_PREFIX = "time":"
INDEXED_EXTRACTIONS = JSON
SHOULD_LINEMERGE = false
EOF
Stop and re-index splunk:
$ sudo /opt/splunk/bin/splunk stop
$ sudo /opt/splunk/bin/splunk clean eventdata
$ sudo /opt/splunk/bin/splunk start
and log in to: http://127.0.0.1:8000
References:
- Splunk: Configure timestamp recognition
- Splunk: Date and time format variables
- How to fix wrong timestamp issues
Index K8s log files on another host
Reference: HowTo pull logs into trusted network from a forwarder located in DMZ
Client configuration
On each Hetzner cloud host:
$ sudo crontab -e

*/15 * * * * cronic sh -c 'rsync -av --hard-links --append-verify --copy-links /var/log/pods /home/<username>/hetzner'
Splunk Server configuration
On target host (Octopus) with the Splunk server install package keychain and as regular user:
$ crontab -e
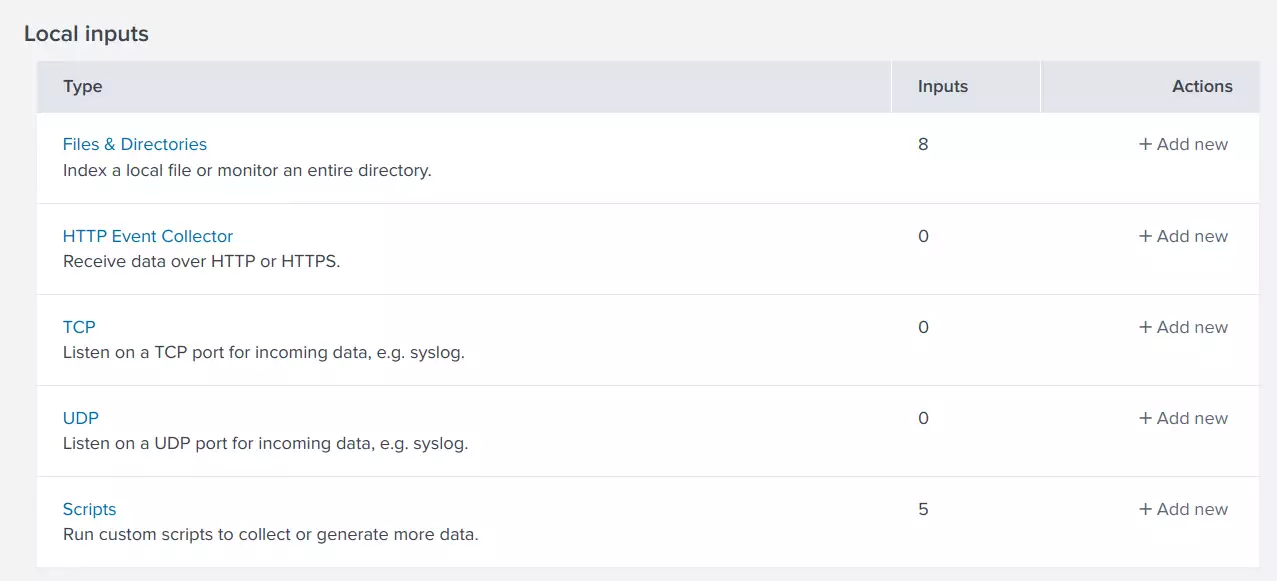
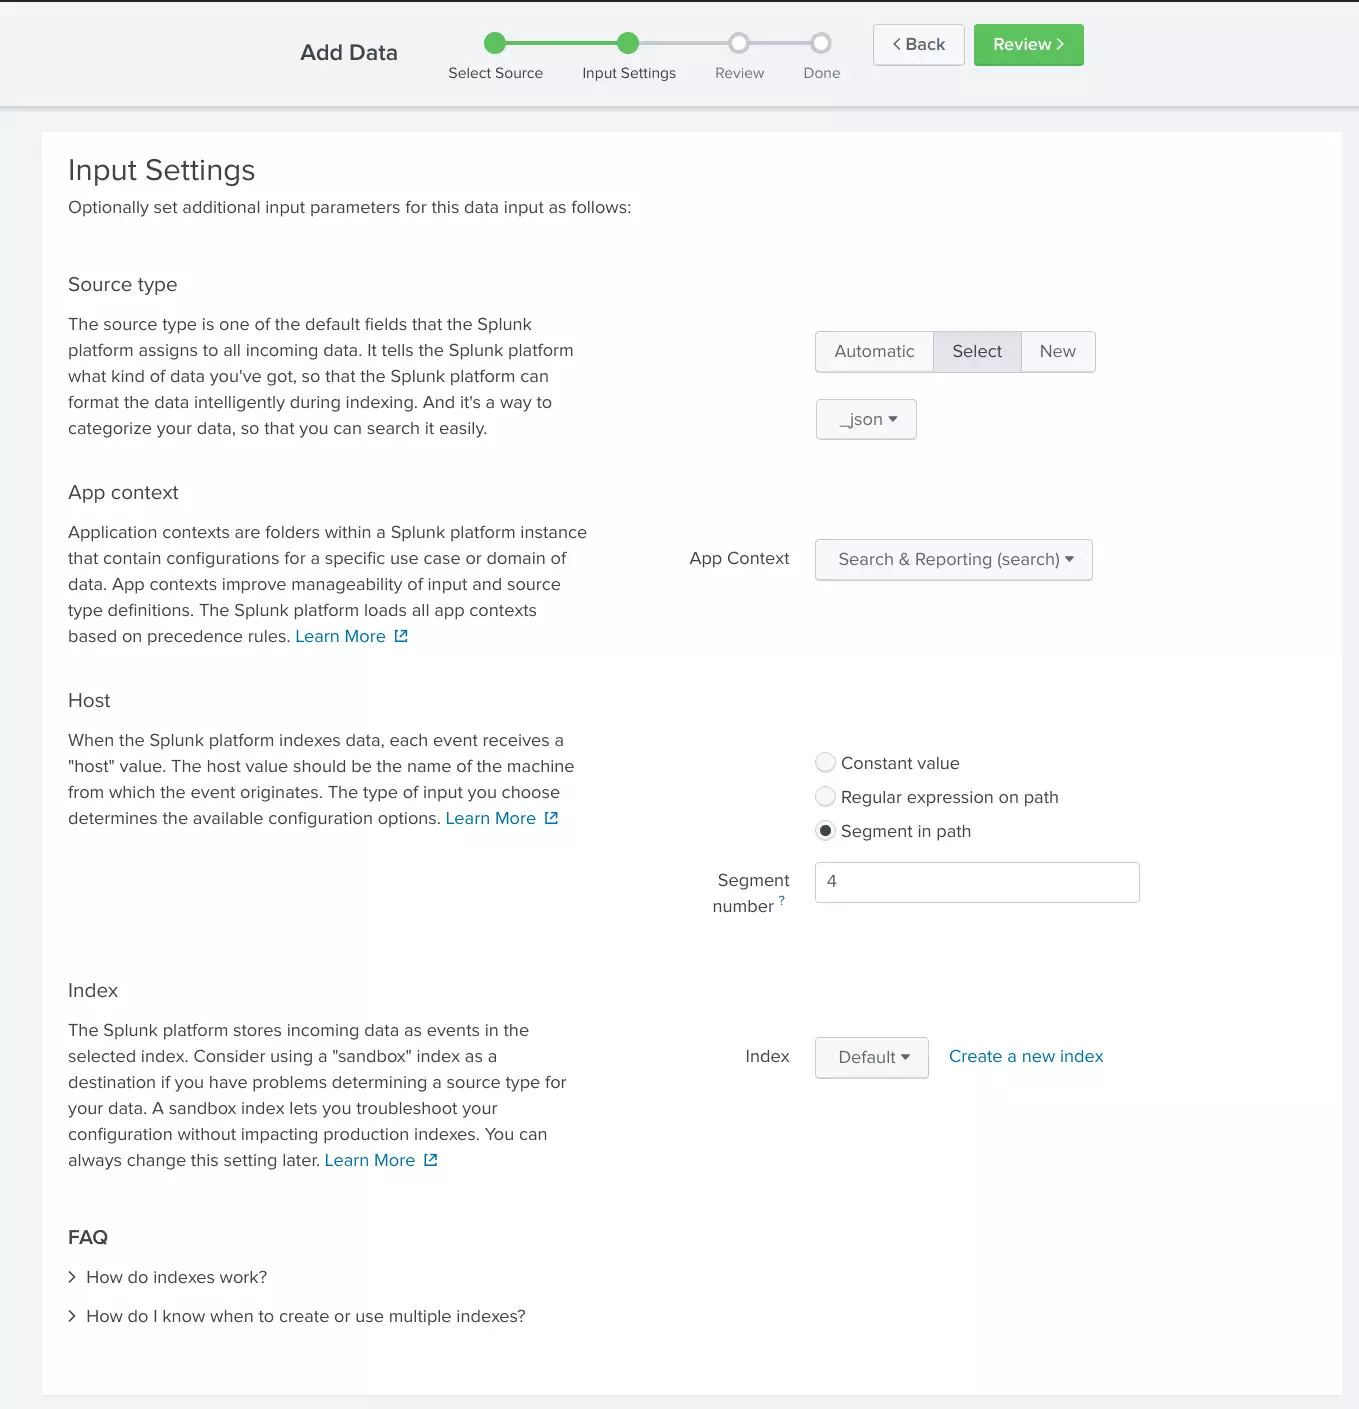
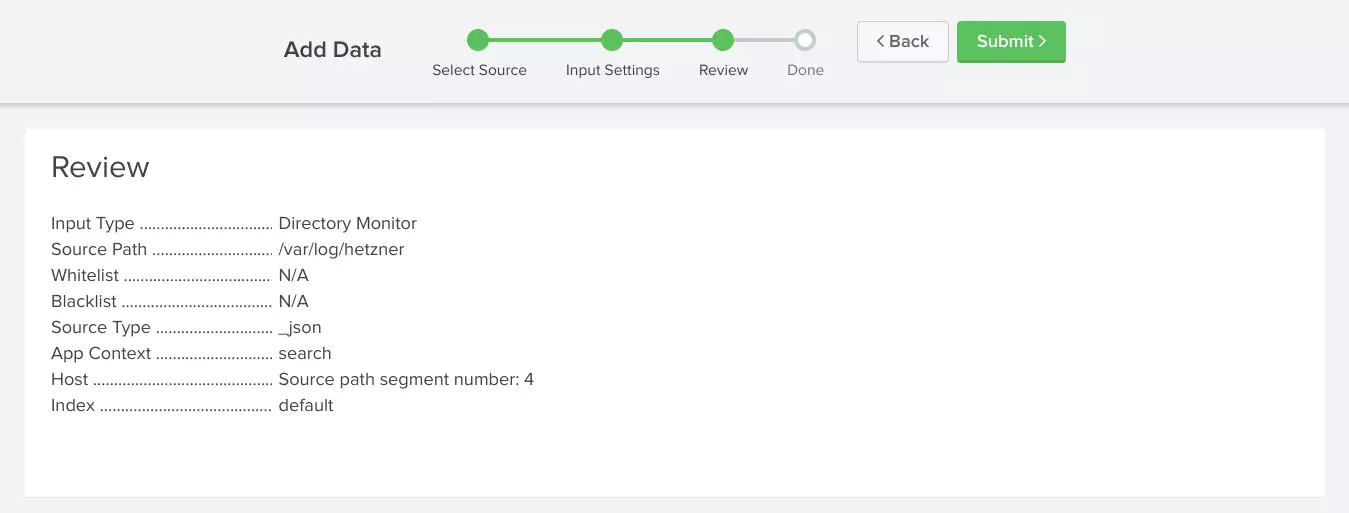
*/15 * * * * cronic sh -c '. ~/.keychain/octopus-sh; for i in `seq 1 3`; do rsync -e ssh -av --append-verify hetzner$i:hetzner/pods /var/log/hetzner/hetzner$i; done'Add the directory being rsynced to the index and use the 4th segment in the directory path as the host name:
Stuff to remember
Splunk searches:
"could not be resolved (3: Host not found) while in resolving client address" OR "client login failed.*client:"
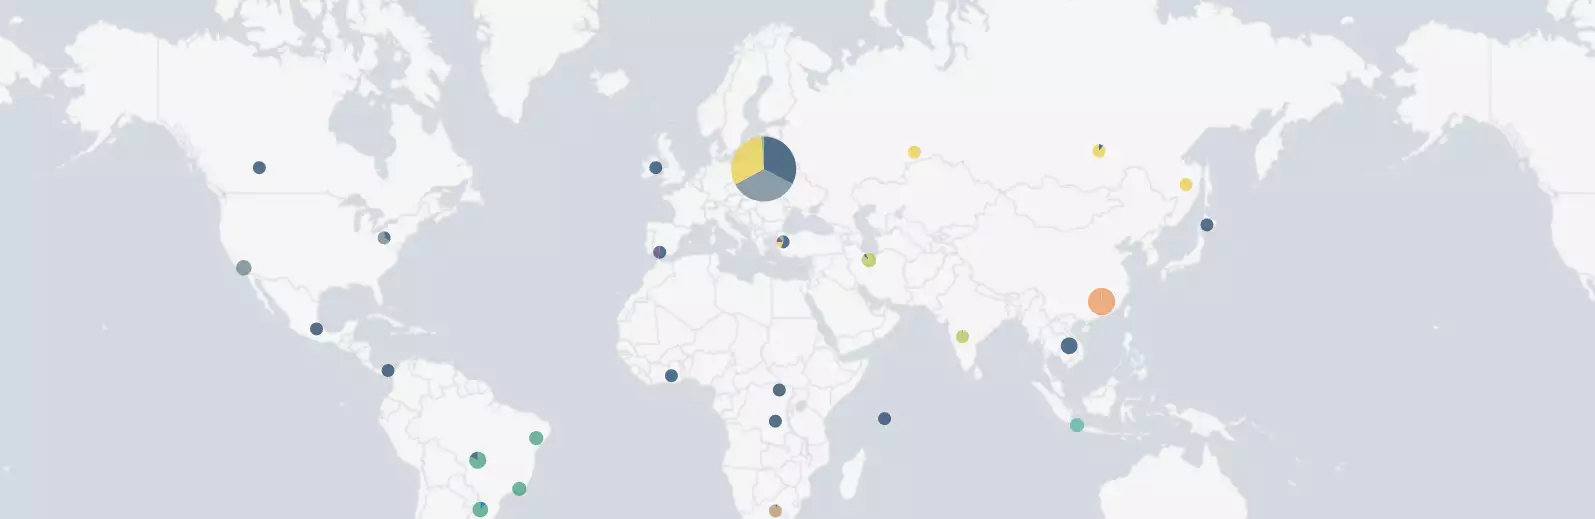
"socketmap:unix:/tmp/podop.socket:domain socketmap server temporary error: unknown error"Visualize client_ips (in my case login bots/attacks):
("could not be resolved (3: Host not found) while in resolving client address" OR "client login failed.*client:") | iplocation client_ip | geostats count by Country